
Transcript: Automating E-Series Management with REST API
Automating E-Series Management with REST API
Hello everyone. I’m Ram Kodialbail storage engineer at NetApp IT. Our team is responsible for all the storage devices and services. The team has six level four engineers, and an extended operations team of 10 for 24/7 support. We manage a little over 400 storage devices, which is about 75 petabytes of data. Today we are going to talk about E-Series management using the REST API. It covers both web services, proxy, and the embedded service. I’ll not torment you with the code walkthrough. We’ll shift from slides midway, and look at the interactive API documentation that I hope will give you a good idea on how to build our orchestration solution with REST API, using your preferred tool of choice. As a reminder, this is a prerecorded session to get around those occasional network issues during live sessions, especially since most of us are still working from home. Feel free to ask questions and we can pause to answer. I’ll also monitor the chat session and answer any questions you may have.
E-Series inside NetApp
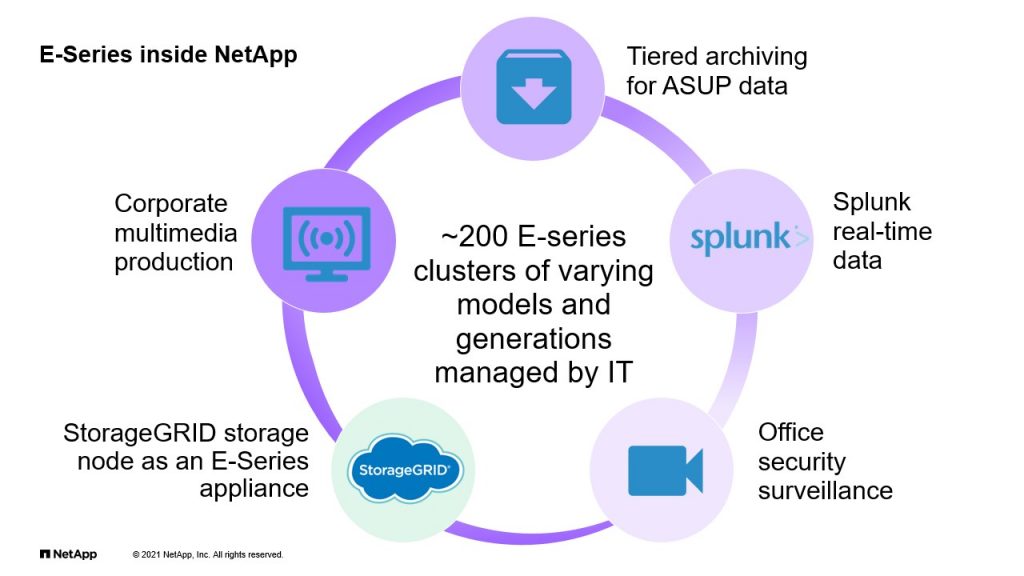
Now, as all of you know, E-Series arrays is our simple, easy to manage, High-performance, low-latency, reliable, block storage. Perfect for video surveillance, high-performance computing analytics and backup recovery workloads. Where do we use E-Series? We have over 200 storage areas across multiple sites. Initial rollout was for our Hadoop clusters, then came Splunk, the StorageGRID storage nodes, as you know, are all E-Series appliances. Our corporate multimedia center uses E-Series and office security surveillance, which is mostly deployed outside our managed data centers. So managing and monitoring all of these areas can be a challenge.
Our Challenge
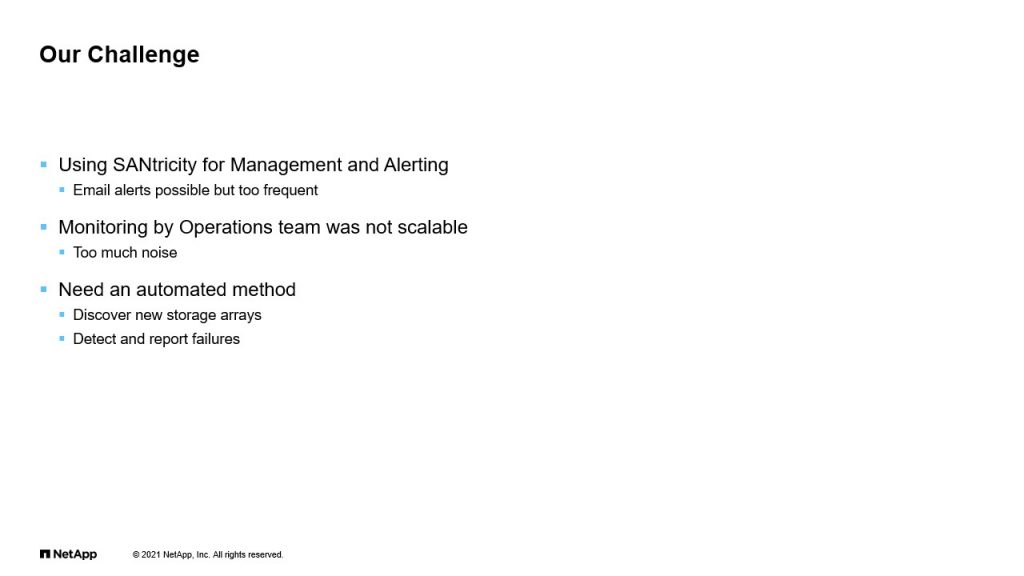
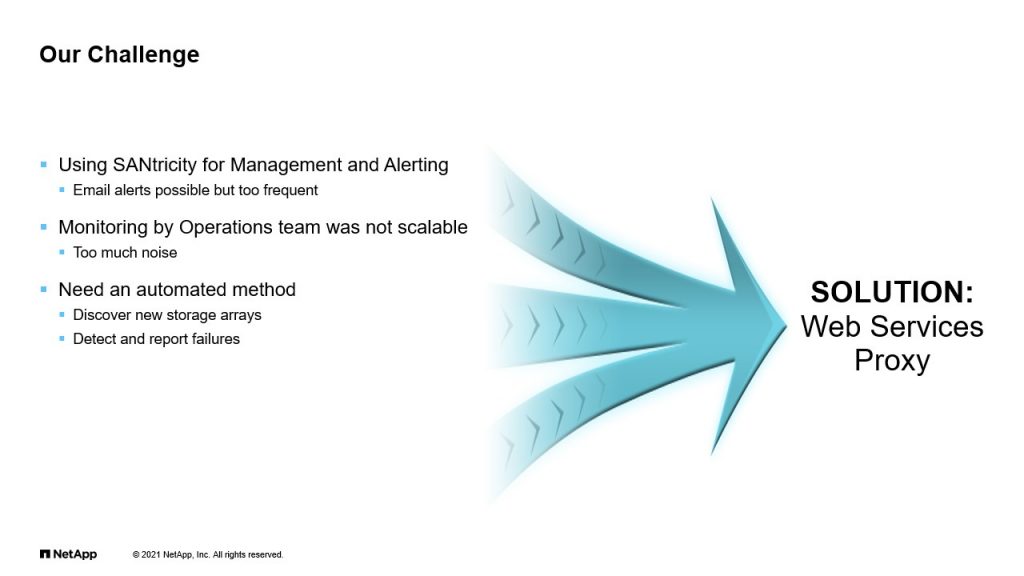
The areas by themselves are rugged but network board can go down, a remote storage area in a building closet may lose a power supply. One or more discs might fail. Alerts from SANtricity manager may go unnoticed and left ignored for several weeks. Consider the case of a new area deployed, but the SANtricity storage manager is not updated monitoring by the operations team based off of email alerts is not scalable, nor reliable. We needed to automate our discovery of new storage arrays and detect and report on. As you may have noted already from the earlier slide, the storage provisioning is managed on the application side. So for now we do not have any need to automate provisioning.
Solution: Web Services Proxy
This is where we considered SANtricity web proxy services, and thought we could build a solution around it.
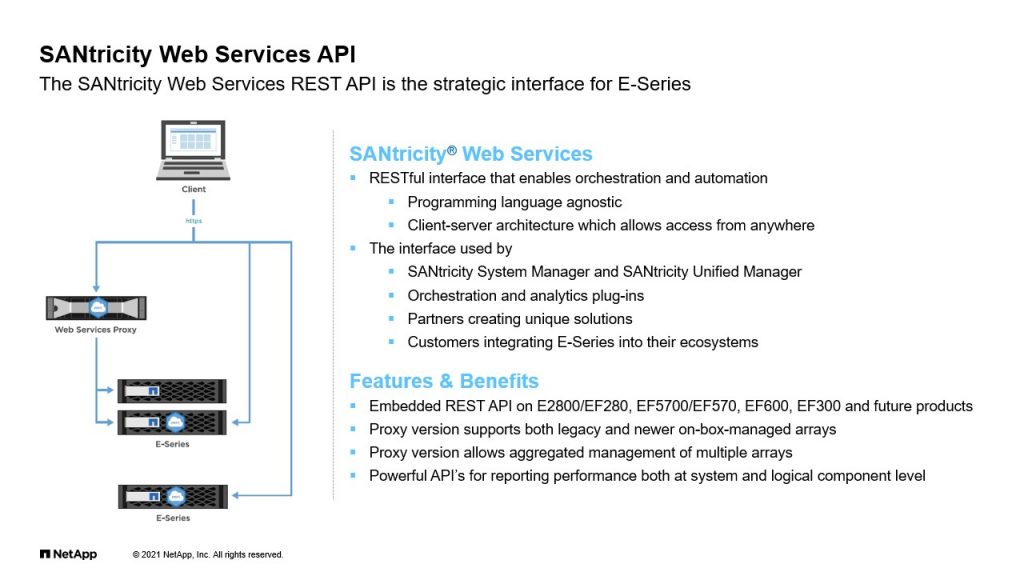
SANtricity Web Services API
Web services proxy gives you a RESTFUL interface to your legacy, which is pre 2,800 arrays, as well as current and future products. You can now use your favorite programming language and have fun with orchestration and automation. You can integrate E-Series into your ecosystems and create unique solutions. The benefit of web services proxies aggregated management of multiple areas. So that’s why I have a personal preference to use the web services proxy, instead of trying to talk to individual storage areas. But it’s up to you. You can, if, if you have fewer E-Series arrays to manage, then you can skip the web services proxy.
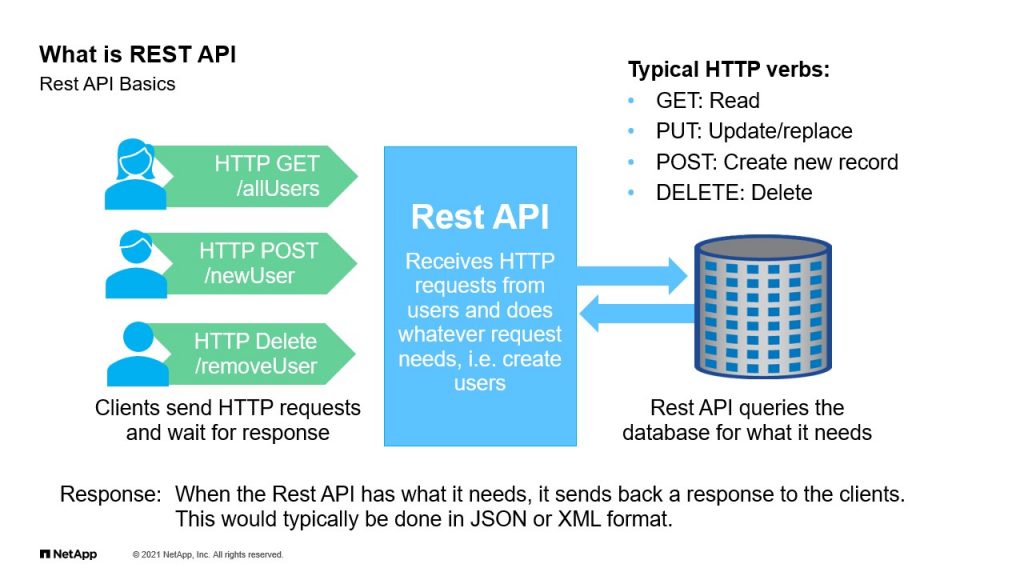
What is REST API?
So let’s talk since I mentioned, let’s talk a bit on that. Most of you may be all too familiar with it already. REST is a set of architectural constraints. When a client request is made, it transfers the representation of the state of the resource to the requester while REST can be used on nearly any protocol. It usually takes advantage of when used for web APIs. Web service APIs that adhere to REST architectural constraints are called RESTFUL APIs. Web API requests will have the following elements, the URL and the HTTP method. The place that API sends requests and where the resource lives is called an end point. The popular SGTP methods get put post and delete are generally supported in most implementations Get method is for reading. Just read from the resource. Put is to update the state or replace. Post creates a new record or submits for a process and Delete as the word indicates it’s a delete operation. But as far as E-Series API is concerned, we only support Get, Post and Delete.
Installing Web Services Proxy
The response will contain the status code and additional data in JSON format if applicable. Let’s look at a few of these status codes, 200, which you may be all too familiar, which is okay. The operation succeeded. 201 means that the Create operation was successful and the object was created. 404 means object not found. 422 indicates bad user input. The response body is populated with JSON payload that has more details about what went wrong. Now, fair warning here. Actions performed through the REST API are without use of prompts or confirmation dialogues. So you got to be very careful there.
API doc reference – Web Services Proxy
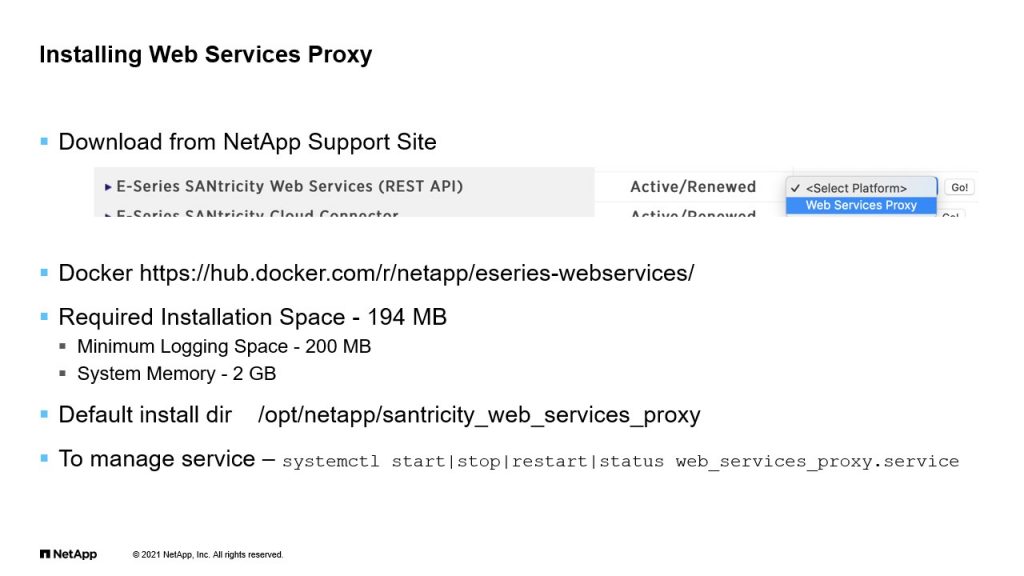
So web services proxy can be downloaded from NetApp support site. The current version is 5.0, Available for windows and Linux as bin, RPM or Docker. Installation is simple and here are the requirements listed. If you have a 2800 or newer array and don’t care for a proxy, there is no need to install. Default installed directory is /opt/netapp.
API doc reference — Embedded
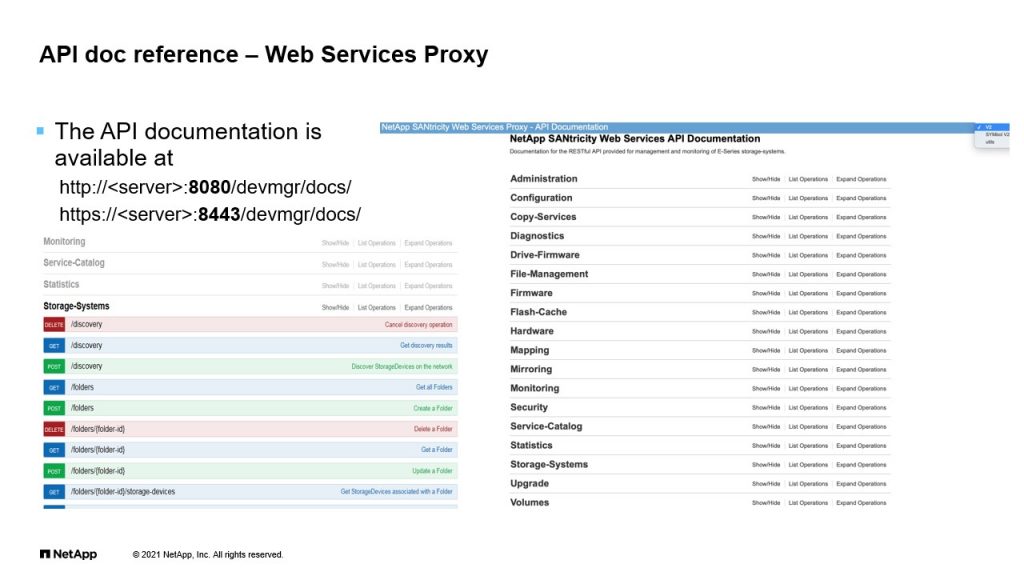
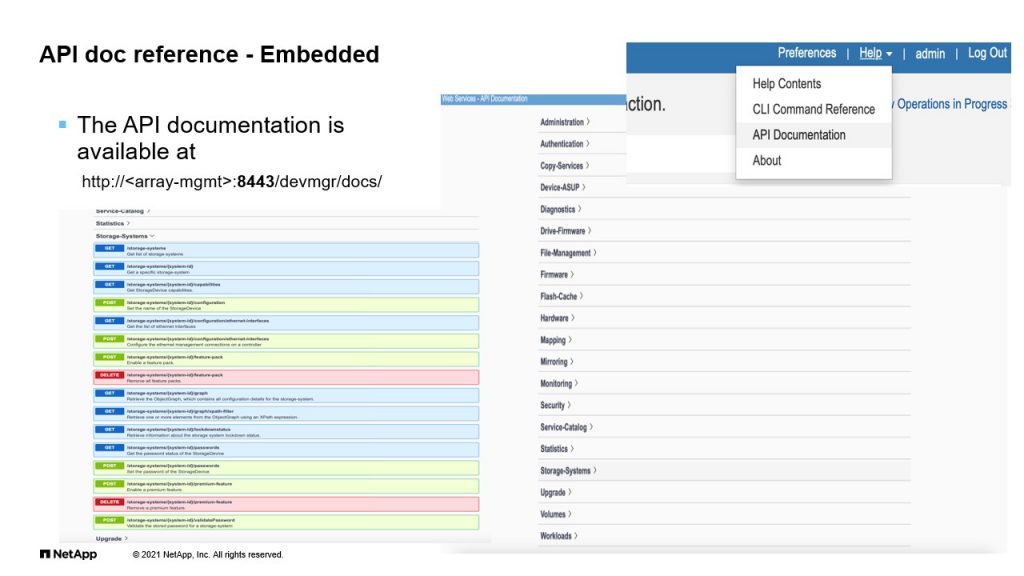
Now here’s a screenshot of the API documentation. We’ll take a look at it. The reports are 8443 or 8080. You can drill down each category and get more details on the end endpoint. Next slide I have for the embedded API on newer storage arrays. They are very similar. The proxy one has more categories and end points, as you will rightly suspect. Now let’s look back to my browser.
DEMO
Take a look at the API documentation. This is the API documentation for the web services proxy. And on this tab is API documentation for a storage array. Notice there’s far fewer categories listed here. So the REST API is URL based and the accompanying API documentation is, as we talked about is interactive, each URL contains or description, and also gives you the ability to perform the action directly through API documentation. Now, to create your API call, you first need to review the interactive documentation. You have to be very familiar with it because you need to figure out the end point, right?
Otherwise you’ll not know how to create your API call. And then you can identify the appropriate method, whether you want to just to a Get or make some changes, in that case, you will make a post call. And finally, the input parameters required for that operation, in some cases it’s optional. The input parameters, right? Communicating with the web proxy, or storage array will involve primary operations, which is one authentication making the request and when you get the response, you will have to check the status code and process the data. Now let’s look at this.
As I mentioned, you got to be familiar. What you’ll have to look at each one of the categories because not every endpoint will be obvious for you. So let’s go back to the proxy documentation. So suppose you’re making or want to initiate a discovery of all the arrays, you can click on under storage systems. You will click on discovery. And if I just do a Get operation, it’ll tell you if there is a Discovery operation active. For notice, it does not require any input. All you need is to make a call. There’s also a call example. All you need as the end and make a Get call.
If you want to initiate a discovery, you will require to provide the start IP and IP for that subnet and leave everything else as default. So you can make the changes here. So you can see, try it out. You can replace that with an IP address and NIP and say, click on execute. And it’ll give you the call example and using that you can build your programming. Now let’s look at, from discovery. Let’s look at if I want to get the storage details, I can go here. Let’s see, try it out does not require any input in this case. I’m just saying execute, logged out.
Let’s say you want to build some automation, take care of some upgrade tasks, in which case it’s not under storage systems. So you’ve got to go look at upgrade category. And you can check the status using Get method or if you want to initiate an upgrade use the Post-call. So that’s why I said you got to be familiar. Now let’s say you want to look at conditions. In which case you might suspect it’s under storage assistance, but it’s not. So what you have to do is figure out where it is hidden ,should be under diagnostics, hopefully. Yep. Right there.
So I’m highlighting all these because I will cover that for this solution that we built. Now let’s say you want to create a volume. You can look at that here. This is services proxy. Let’s switch over to our array. Look at volume. And so that’s all the documentation you need. In this case, when you’re targeting the API call for a storage array or a volume, anything like that, you need to get the ID of the resource. And that you can acquire by making a weed operation at another end point and then use that in the actual call. So let’s go back to our slide deck. So if you want to look at the API documentation, I think I forgot to mention the port. So it said 8443 or 80 80, and it’s a dev manager docs. You can also get to the API documentation by clicking here from your web interface. You can see, go to help and say API documentation. That’ll bring you here.
Access Levels
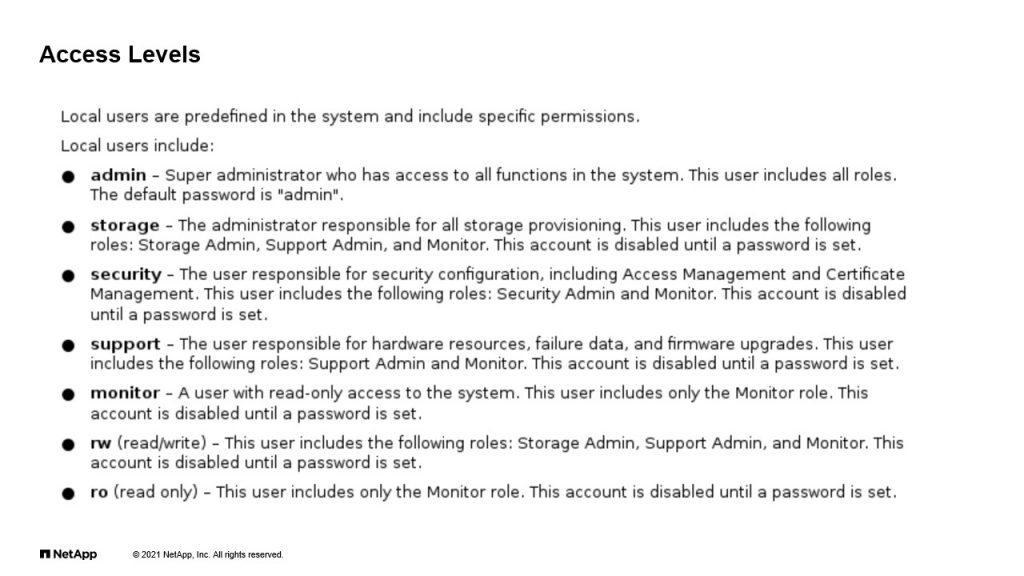
Go back to our slide. Now I mentioned authentication. So there’s a predefined roles for admin that has access, or others with limited or read-only access, right? So for most of my automation targeted at arrays directly, I could just choose to use admin or on the web services proxy I could use read-write or read only these two here.
Our solution for the inventory and monitoring problem
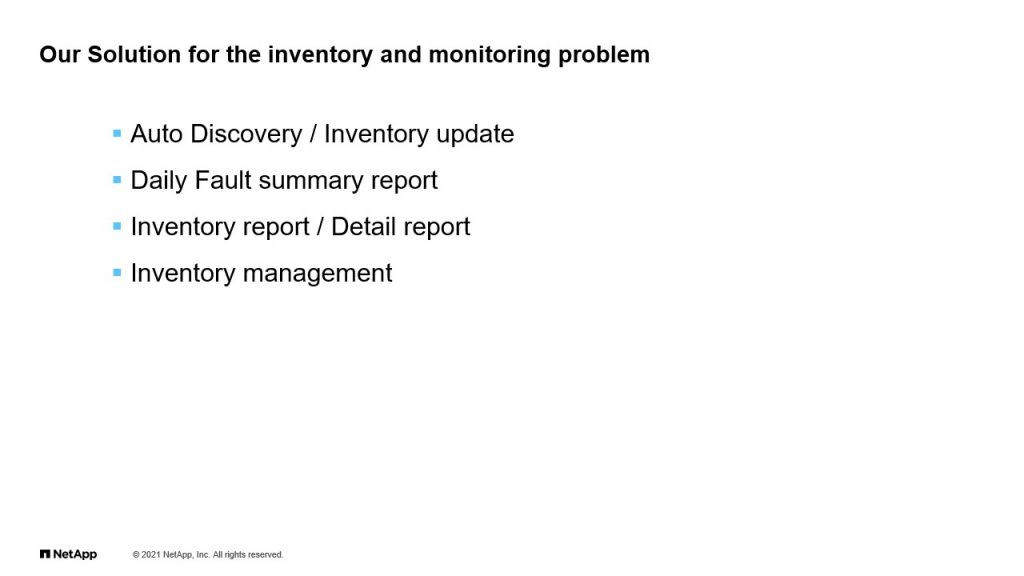
Now for the operations issue that we talked about, we developed the following solution using web proxy, an automated discovery process that runs daily and updates the inventory for us, fault report listing one or more events. A single summer Trice report instead of one, for each fault condition and ability to generate an inventory report and the ability to manage the inventory. Let’s take a quick look at those.
Auto Discovery
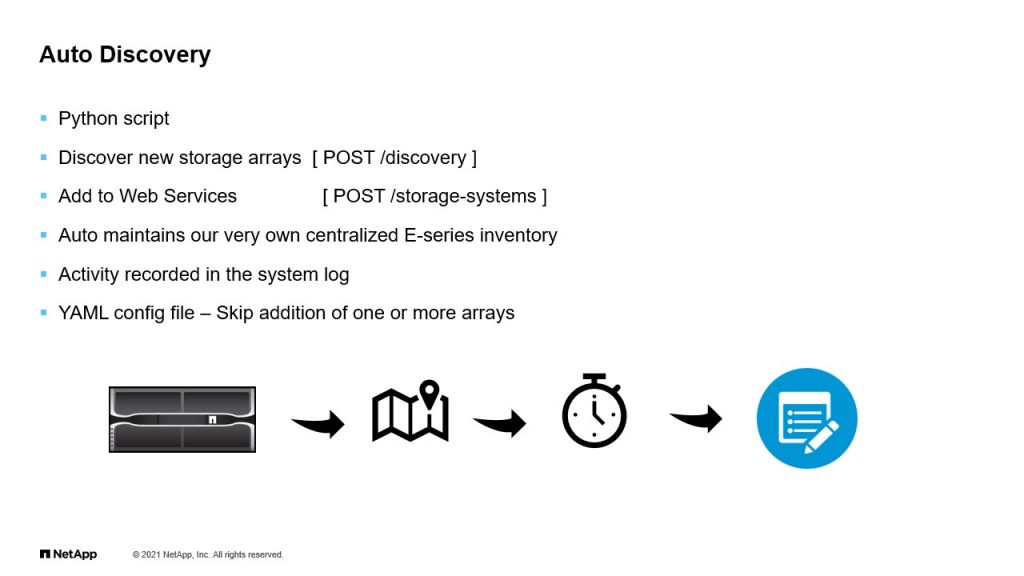
For auto discovery, we developed a Python script that runs daily. Basically all it’s doing is making a discovery and adding a new area when found using storage systems API. Remember we looked at discovery as well as storage systems endpoint. With this, we now have the ability to maintain a centralized inventory. The activities recorded in the system log. YAML config file tells the Python script, which subnet ranges to scan, and also has the option of ignoring an array. Remember, we saw that in the discovery detail, start IPN and IP. So that’s where the Python script picks up the sub-net range. Say a test array that we also have the ability to ignore an array when say there’s a test array that is not managed by NetApp IT.
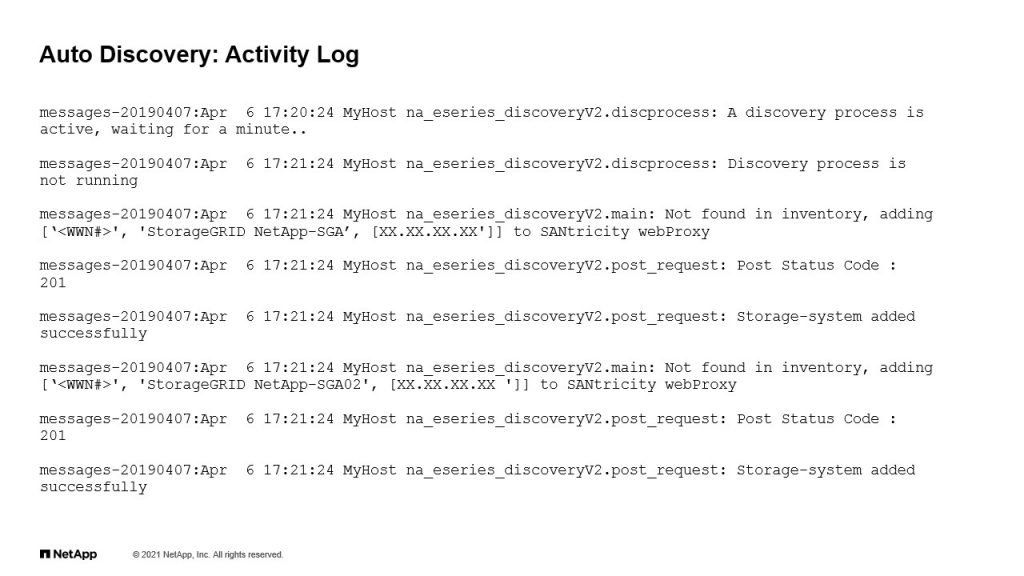
Auto Discovery: Activity Log
So here’s a view of the activity log. We have discovered a new array and added it to the inventory here.
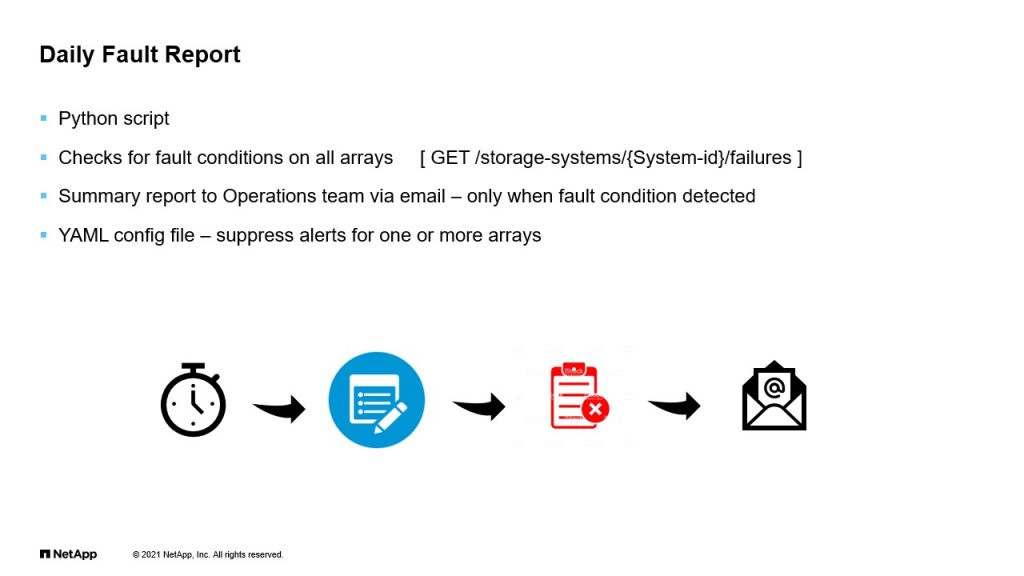
Daily Fault Report
We looked through the arrays in the inventory and check for fault conditions using the storage systems, failures, API endpoint. We’ve looked at that when we reviewed the interactive documentation. A summary report is generated and notifies the operations teams via email. If there are any unresolved fault conditions or any of the storage arrays in the re-entry, only then it sends out an alert if a storage arrays in maintenance and you intend to suppress the alerts, we can add it to a YAML config file. Next slide.
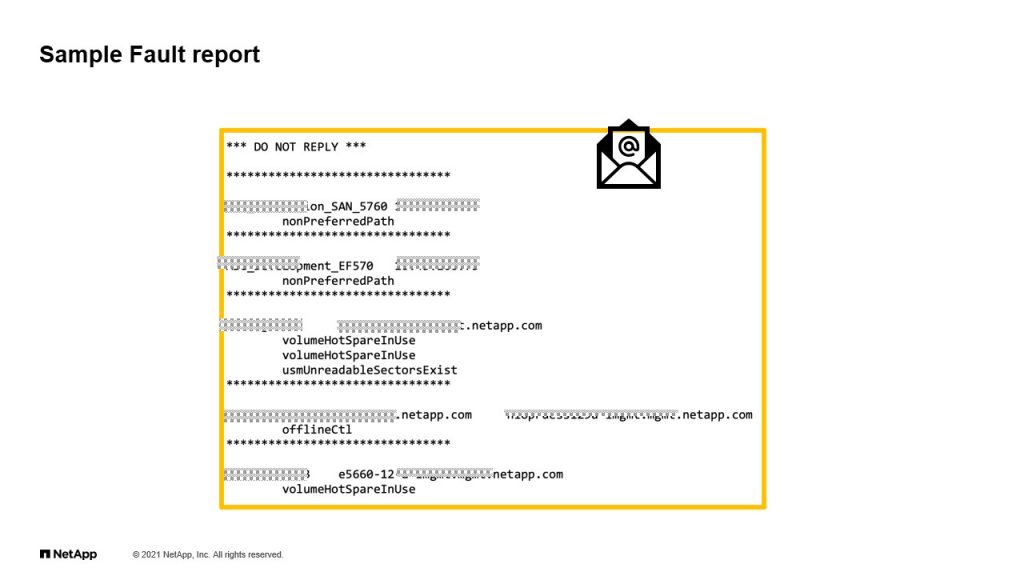
Sample Fault Report
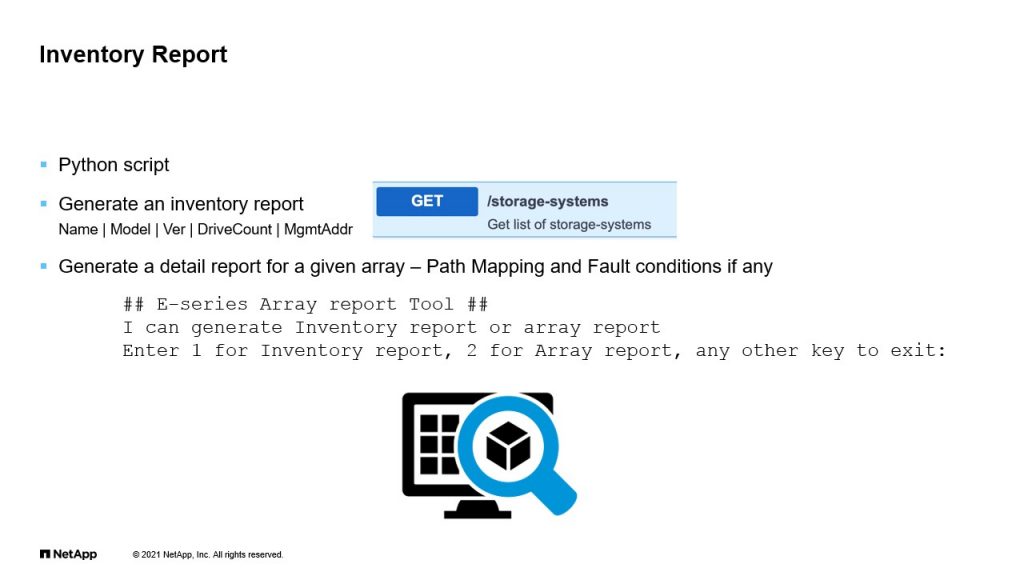
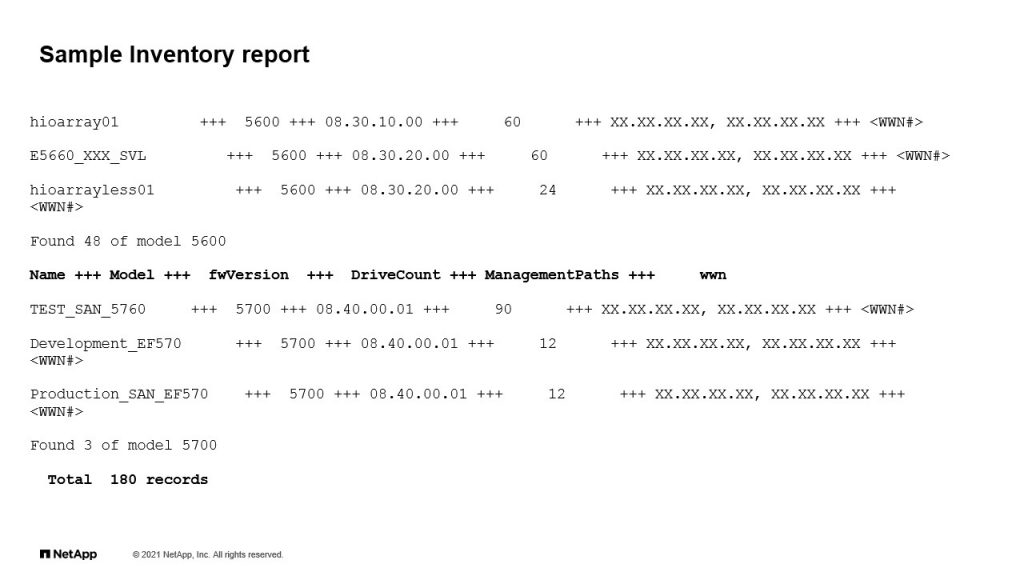
Here’s a sample of the fault report, if a controller is unreachable and offline alert is generated, you can see some of the fault conditions reported here. There’s a preferred path warning and hot spares in use, a controller is offline, basically it’s unreachable. So they can go. The operations team will have to go and review research and fix that. For the inventory report, all that we need to do is use the storage systems API call. This script has the ability to generate a high level inventory report or a detailed report for our particular array and share a view of each. Here we have sample inventory report listed by model and count for each model.
Sample Full Array Report
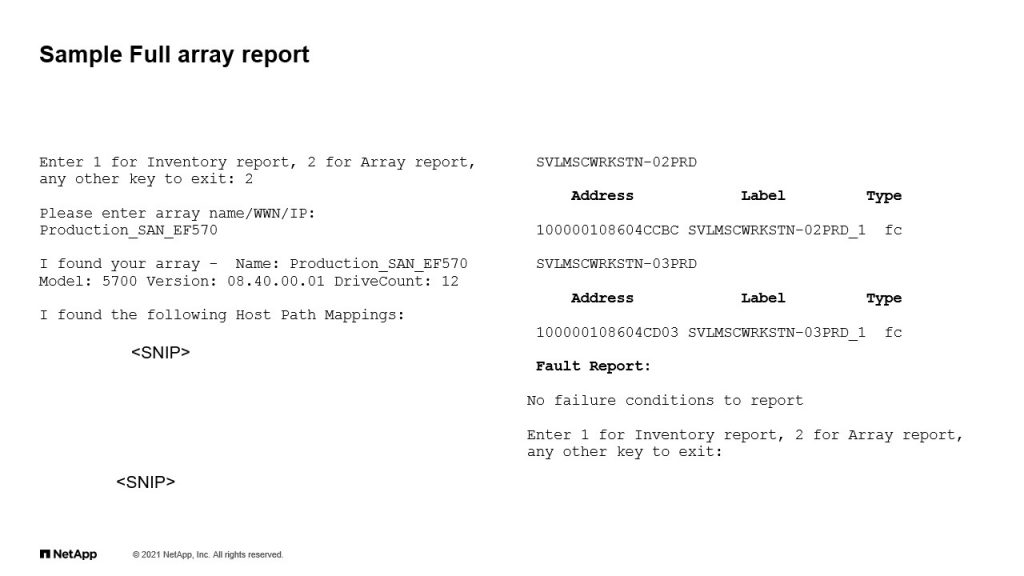
And in this slide, you have a detailed sample report. You can see the CD hotspot mapping details. And if there are any fault conditions. In this case, there are no fault conditions.
Inventory Management
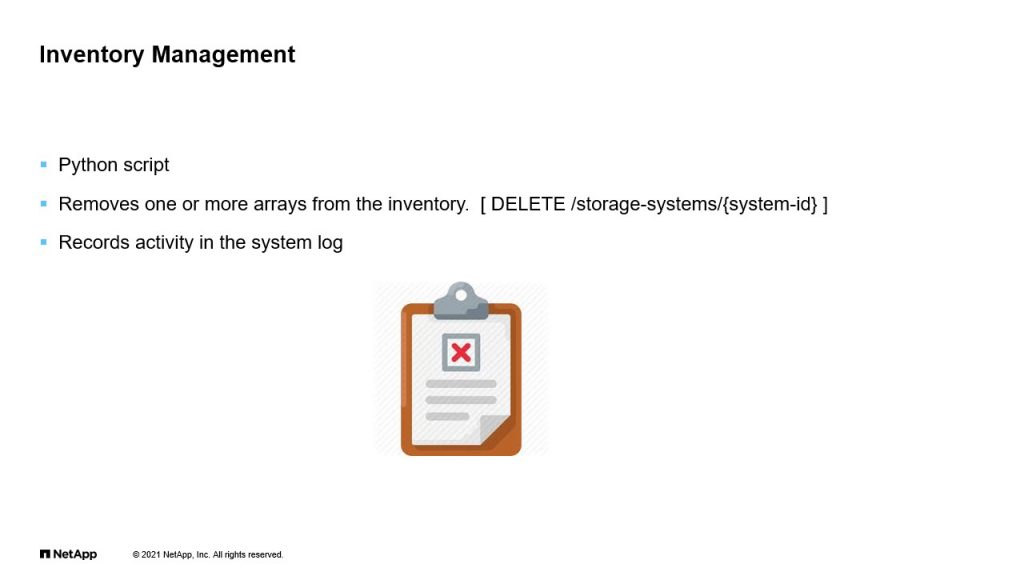
Finally, we have a script to manage the inventory. All it does is a simple delete operation on the storage system device. I let that here delete for the storage systems and the system ID and any activities of course reported in the system log. If you are interested, I have a Python start script with Get and Post functions. It fetches the controller and volume statistics. All you need to do is update the inventory file with the IP address of your storage arrays and play it on endpoints. The script that I’m talking about does not talk to a web proxy. It talks to the storage array directly. So you’ll have to update the inventory wire YAML file. If you are interested, you can reach out to our NetApp on NetApp coordinator, and I can share the script with you. Now, you might say, this is all good, but this involves a bit of code development, which I don’t want to pursue right now. Is there any other option?
Give me another option!
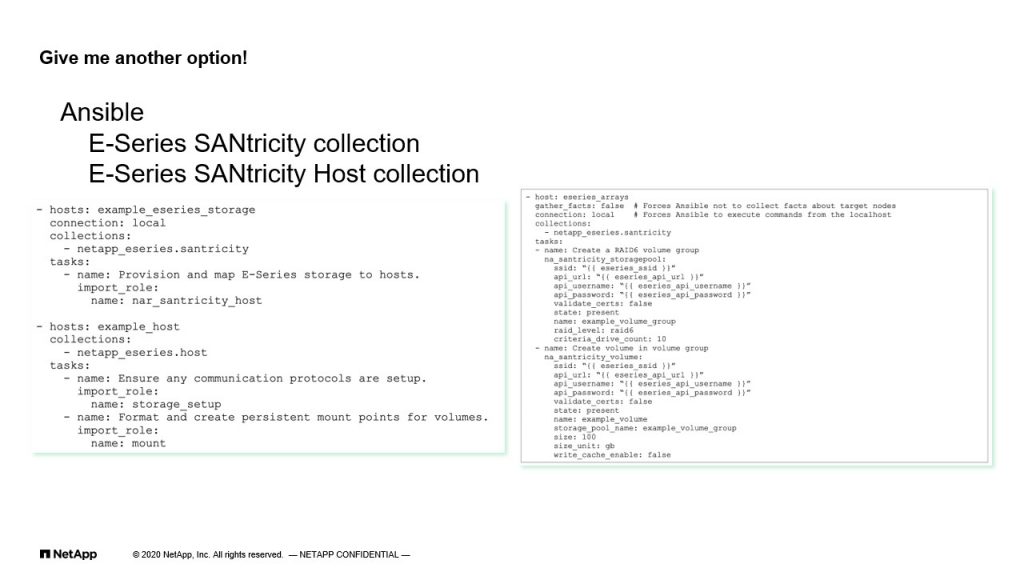
So the option I have is our Ansible collection modules. All you need is some knowledge of Ansible playbook, and you can be an E-Series automation pro. We have modules and roles, as you can see here, for both array and host site automation. I have a link to our related technical report in the next slide.
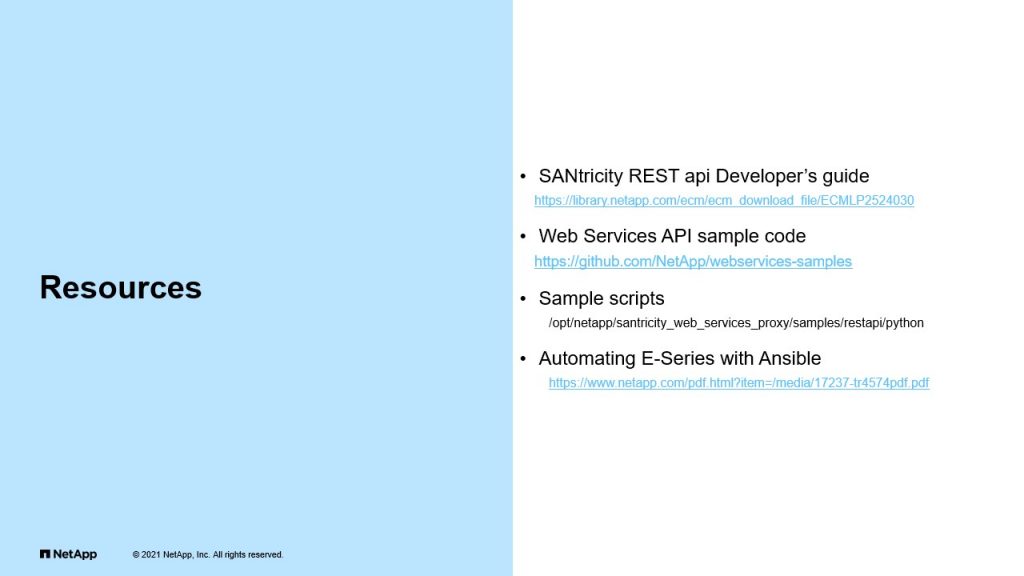
Resources
I hope you found this presentation useful. Here are a few handy resources. The first one is an old document, but I personally found it useful when developing my scripts. The second link has a bunch of sample code. These are web services, proxy specific, but you can adapt them for storage use. When you install web services proxy, you have some sample scripts in the path provided here. And here is that TR article I mentioned earlier. If you have any follow-up questions later and need some guidance, NetApp IT is here to assist you. Thank you all.